Project Overview: Hire Me for Similar Power BI Work
This project demonstrates the caliber of work you receive when you hire me as a freelance Power BI developer. Built entirely in Power BI using eight years of real financial statement data from AECOM (NYSE: ACM), this dashboard showcases my expertise in financial analysis, DAX development, and business intelligence storytelling.
When you hire me for your Power BI project, you get:
- ✅ Production-ready dashboards built on your real financial or operational data
- ✅ Custom DAX measures for metrics that matter to your business (not just standard KPIs)
- ✅ Star schema data modeling for performance and scalability
- ✅ Clear documentation and training so your team can maintain the solution
- ✅ Fixed-price proposals with defined deliverables and timelines
Commercial Intent Focus: This isn't just a portfolio piece—it's proof of the ROI-focused approach I bring to every client engagement. Need this level of insight for your business? Hire me as your freelance Power BI developer to build your custom financial dashboard.
All data was sourced from AECOM's publicly filed financial statements (10-K filings, 2018 to 2025). The data model, DAX measures, and dashboard design were built entirely from scratch in Power BI Desktop—a methodology I replicate for every client project.
About AECOM (NYSE: ACM) & Why This Matters for Your Business
AECOM is one of the world's leading infrastructure consulting firms, providing design, engineering, construction management, advisory, and program management services across transportation, water, environment, facilities, and energy markets. The company operates in over 150 countries with approximately 51,000 employees and reported $16.1 billion in revenue for fiscal year 2025.
Why this case study matters if you're looking to hire a Power BI developer: AECOM presents an analytically rich case study—a company that simultaneously navigated a revenue trough, executed a major strategic pivot, compressed its cost structure, and rebuilt profitability margins. Eight years of that journey produces a dataset that tests every dimension of financial analysis. This complexity is exactly what I solve for clients when they hire me for Power BI dashboard development services.
Relevant to Your Industry? I've built financial and operational Power BI dashboards for infrastructure consulting (like AECOM), retail/e-commerce, SaaS businesses, banking, and professional services. See my SaaS trial conversion analysis or retail BI dashboard for similar multi-year business analysis approaches.
Methodology: The Process You Get When You Hire Me
When you hire me as a freelance Power BI developer, your project follows this structured analytical workflow from raw data to published interactive report:
Data Collection and Structuring
I extract income statement, balance sheet, and cash flow data from your source systems (ERP, accounting software, CSV exports, APIs). Data is structured into normalized tables to support a clean star schema model in Power BI—ensuring performance and maintainability.
Power Query Data Transformation
Power Query is used to clean, reshape, and append your data into unified fact tables. Date tables are built programmatically to enable time intelligence. Calculated columns are added for year-over-year comparisons, rolling averages, and period-over-period percentage changes—customized to your business logic.
DAX Measure Development
I write custom DAX measures to produce the metrics visible in your dashboard. These include standard financial KPIs (EBITDA margin, free cash flow, current ratio) and custom analytics measures (Capital Allocation ROI, Financial Resilience Score, Scaling Efficiency index) tailored to your strategic questions. Learn about my Power BI dashboard development services for full details.
Dashboard Design and Storytelling
Each report page is designed with a specific analytical question in mind. I use visual hierarchy, color coding, and interactive filters to guide users through the financial story—ensuring stakeholders can act on insights, not just view data.
Live Interactive Dashboard: See What You Get When You Hire Me
Explore the full Power BI report below. This is the caliber of deliverable you receive when you hire me for Power BI dashboard development. The dashboard contains three pages—use the navigation arrows at the bottom of the embedded report to move between sections.
Executive Overview: Key Findings (The Insight You Get When You Hire Me)
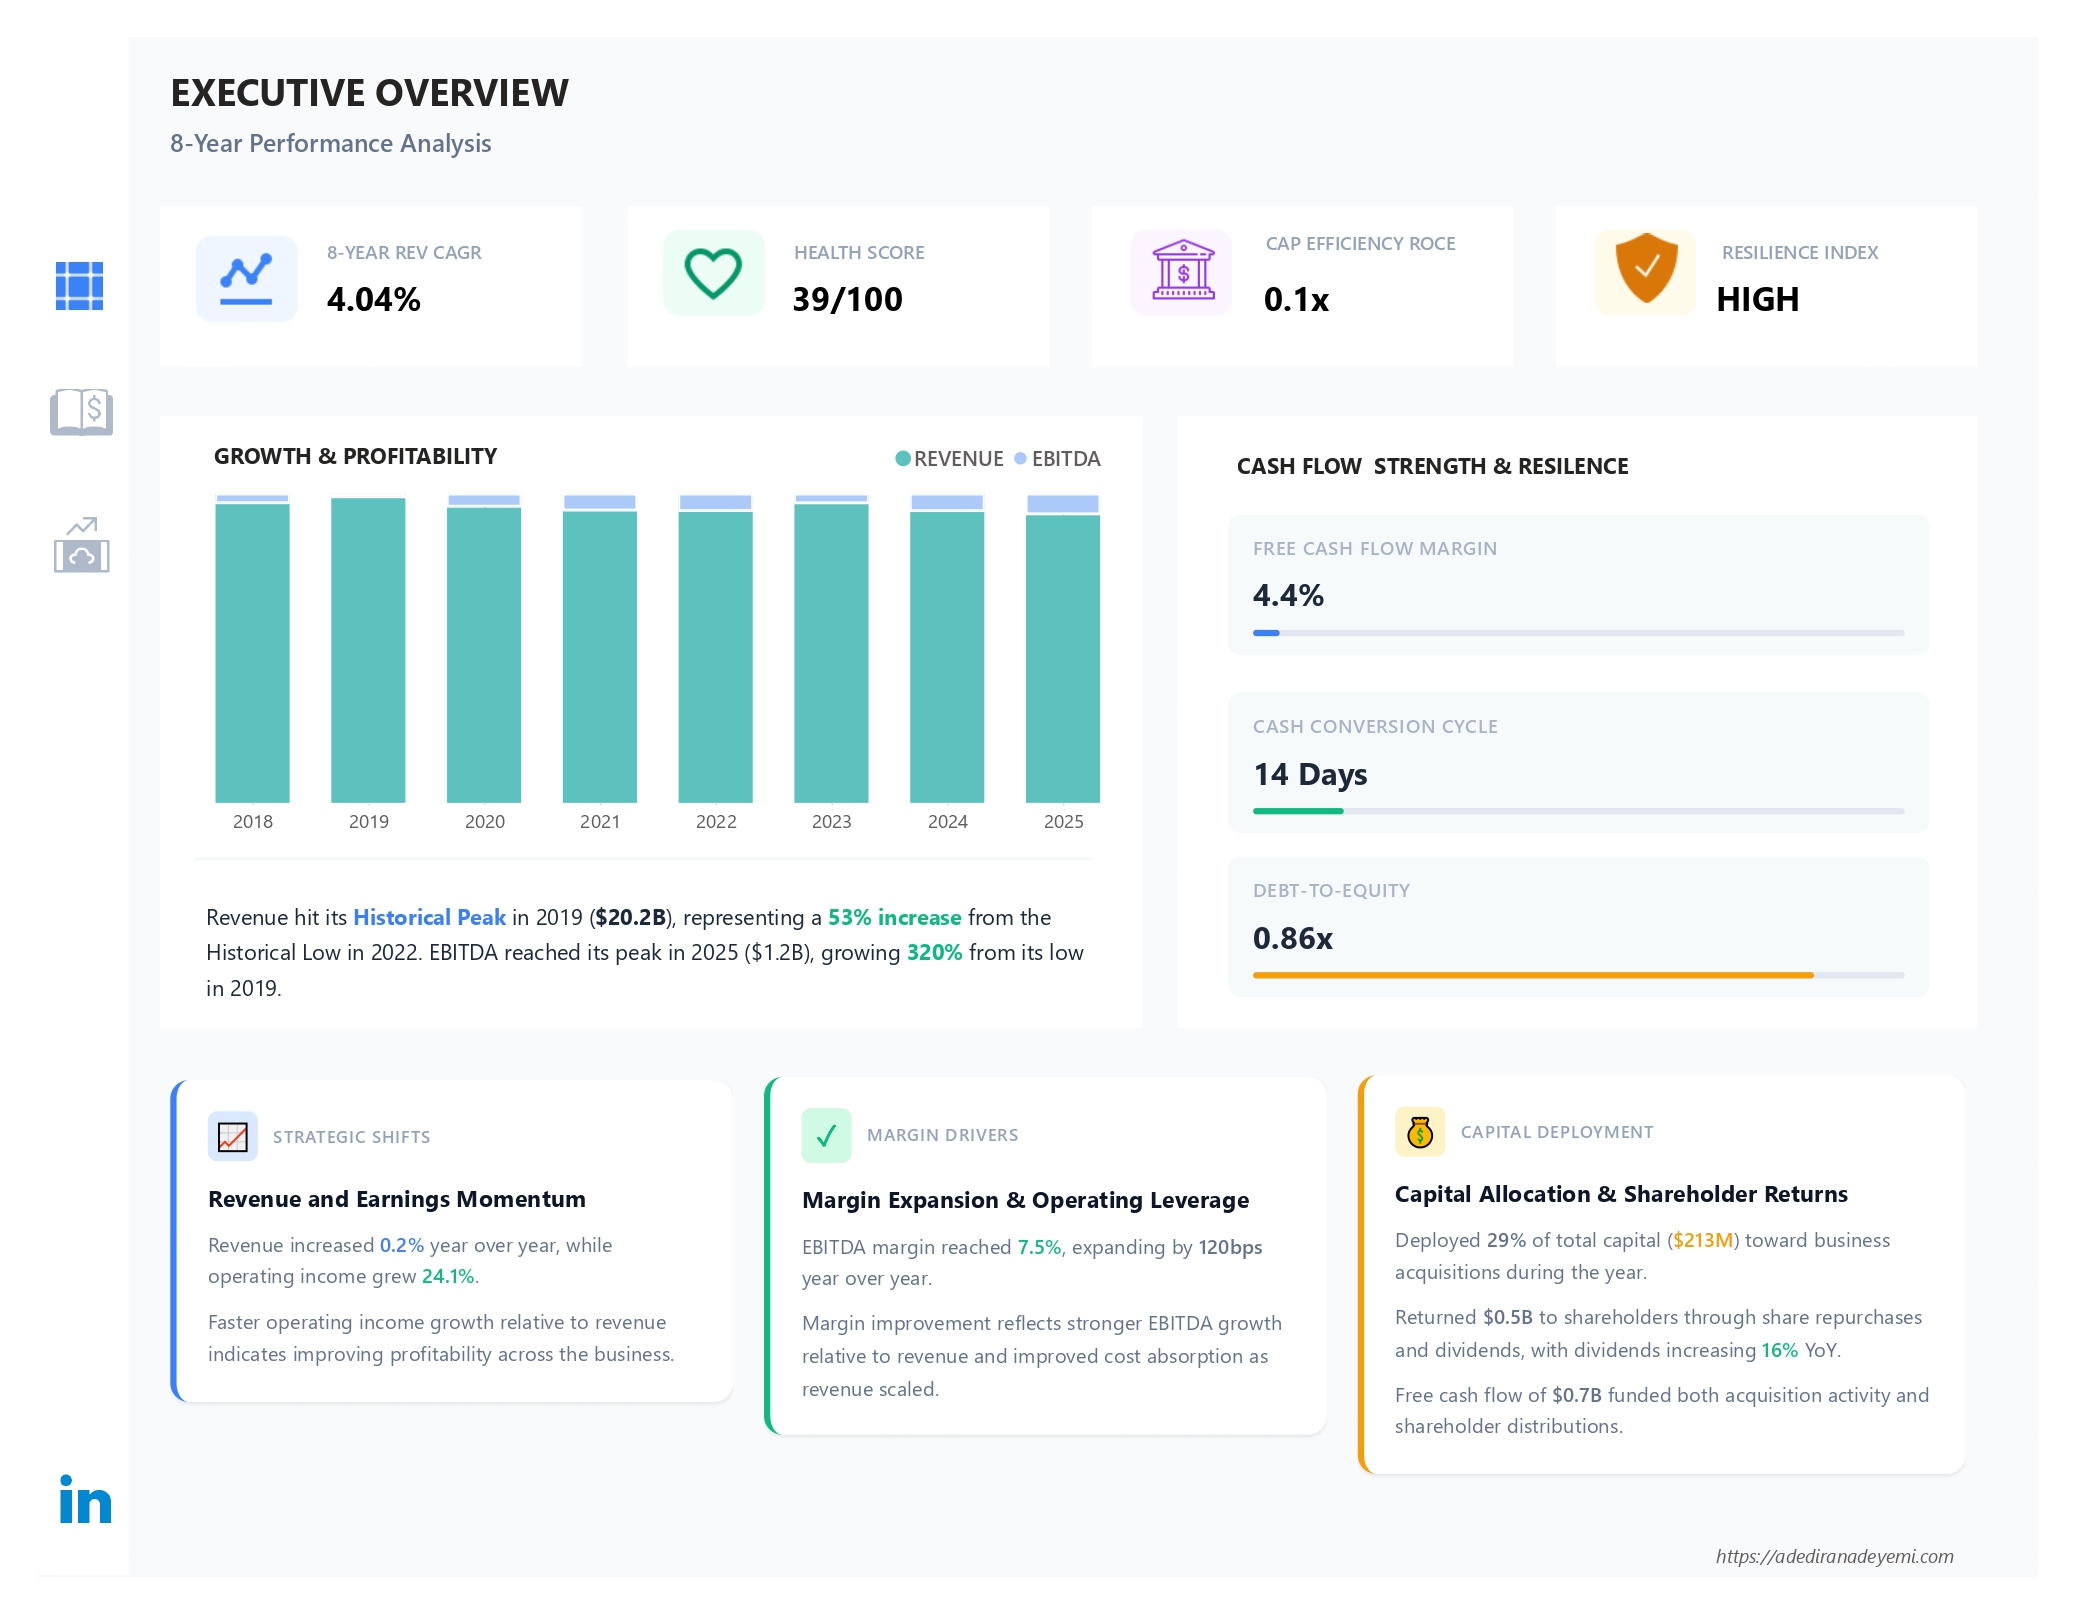
The Executive Overview page surfaces the top-line performance story across the full eight-year period, anchored by four composite KPIs. This is the level of strategic insight I deliver when clients hire me for financial dashboard development.
Revenue Historical Peak (2019)
Revenue hit its eight-year high in 2019, representing a 53% increase above the historical low recorded in 2022 — the trough of AECOM's strategic restructuring period.
EBITDA Growth (Trough to Peak)
EBITDA reached its eight-year high of $1.2B in 2025, growing 320% from its 2019 low — a direct result of the shift from construction-heavy revenue to higher-margin professional services.
Operating Income Growth (YoY)
Revenue grew just 0.2% year over year in 2025, yet operating income grew 24.1% — a signal of improving operational leverage and cost absorption as revenue scales.
Shareholder Returns (2025)
AECOM returned $0.5B to shareholders through share repurchases and dividends in fiscal 2025, with dividends increasing 16% year over year — funded entirely by free cash flow of $0.7B.
Strategic Shifts Visible in the Data
The most analytically interesting signal in the Executive Overview is the divergence between revenue and EBITDA trends. Revenue declined from its 2019 peak and has grown only modestly since 2022. EBITDA, however, has grown consistently and rapidly across the same period. This divergence is the financial signature of AECOM's strategic pivot away from lower-margin construction services and toward higher-margin professional services — a decision that compressed revenue in the short term but dramatically improved the quality and durability of earnings.
EBITDA margin reached 7.5% in 2025, expanding by 120 basis points year over year. This margin expansion, while still below the 10%+ target AECOM's management has guided toward, represents consistent progress over the full eight-year observation window.
Capital Deployment in 2025
AECOM deployed 29% of total capital ($213M) toward business acquisitions during the year, alongside $0.5B in shareholder returns. Free cash flow of $0.7B funded both activities — demonstrating that the capital return programme is being sustained by operating performance rather than by borrowing or asset sales.
Capital & Balance Sheet: Solvency and Allocation (Custom DAX Expertise)
The Capital and Balance Sheet page addresses the fundamental question every investor and creditor asks: is this company financially resilient, and is it deploying capital effectively? This is the type of custom DAX development you get when you hire me for Power BI consulting services.
Solvency Trajectory
Current liabilities of $5.9B fell 7.0% year over year in 2025, reducing short-term pressure on the balance sheet. The debt maturity profile is conservative — 2% short-term and 98% long-term — which means the company faces minimal refinancing risk in the near term. Interest coverage of 5.6x comfortably services the existing debt load.
FCF Sustainability
With operating cash flow of $822M and maintenance capex of $176M, the FCF retention rate is 79% — meaning the business retains 79 cents of every operating dollar after maintaining its asset base. Dividend capacity of $646M sits well above actual dividend payments, providing a significant safety buffer for the capital return programme.
Capital Allocation ROI by Channel
The most provocative finding on the Capital and Balance Sheet page is the capital allocation ROI breakdown—custom DAX measures I build for clients who hire me for Power BI dashboard development:
Organic growth capital generates 751.1% ROI — dwarfing the returns from share buybacks (3.6%) and M&A integration (0.3%). This finding has direct strategic implications: given the ROI differential, every dollar reallocated from acquisitions toward organic growth initiatives would generate dramatically higher returns on invested capital. This is the kind of actionable insight that justifies hiring a Power BI developer at this level of expertise. Learn about my Power BI consulting services.
Profitability & Cost Analysis
The Profitability and Cost Analysis page examines whether the improving EBITDA story is backed by genuine cost discipline or is masking structural inefficiencies in the cost base.
Cost Structure: 98% Variable
AECOM's cost base is 98% variable — almost entirely composed of delivery costs, with corporate overhead at 1.0% and transformation OPEX at 0.8%. This cost structure means the business has very limited operating leverage in the traditional sense: costs scale proportionally with revenue. However, it also means the business is highly resilient in a revenue downturn — the cost base contracts with revenue, protecting cash flow.
Scaling Efficiency and Earnings Quality
The Scaling Efficiency index of +4,839% measures how much faster operating income has grown relative to the cost base over the full eight-year period. This extraordinary figure reflects the cumulative effect of multiple years of cost discipline — particularly in corporate overhead and transformation OPEX — combined with a shift toward higher-margin revenue. Revenue vs Operating Cost charts confirm that the gap between revenue and cost has widened meaningfully since 2022.
Earnings quality — measured by the relationship between net income and operating cash flow — shows healthy alignment, with operating cash flow consistently exceeding net income in recent years. This indicates that reported earnings are backed by actual cash generation rather than accounting accruals, which is a key quality signal for investors and analysts.
Return on Invested Capital Trajectory
ROIC has grown from 0.01 in 2018 to 0.55 in 2025 — a 50-fold improvement over the observation window. This is the single most compelling number in the entire dataset. A ROIC of 0.55 means that for every dollar of invested capital, AECOM is generating 55 cents in operating return — an exceptional figure for a professional services business of this scale. The trajectory confirms that the strategic pivot has not just improved margins but has fundamentally changed the capital efficiency of the entire business model.
Tools & Technologies: The Stack I Use for Client Projects
When you hire me for Power BI dashboard development, your project is built using the Microsoft BI stack throughout, making it reproducible and maintainable for any organisation already using Microsoft 365.
💰 Power BI Project Pricing & How to Get Started
When you're ready to hire a freelance Power BI developer, transparency matters. Here's what to expect:
🎯 Typical Project Scope & Investment
Note: All projects begin with a free discovery call. You'll receive a fixed-price proposal with defined deliverables before any work begins. No hourly surprises.
My Process: Simple, Transparent, Results-Focused
Free Discovery Call (30 min)
We discuss your business question, data availability, and success metrics. No pitch, no obligation. I'll tell you if Power BI is the right solution for your needs.
Scoped Fixed-Price Proposal
Clear deliverables, timeline, and pricing. ROI targets defined upfront. You approve before any work begins.
Build & Weekly Demos
Transparent communication, iterative development, and progress demos. You stay in control and can request adjustments.
Deploy, Train & Support
Production-ready delivery with documentation, user training, and 30 days of post-launch support. No vendor lock-in.
Why clients hire me over agencies or junior freelancers:
• 4+ years building production-ready Power BI systems (not just tutorials)
• Financial domain expertise—I understand EBITDA, ROIC, cash flow, not just drag-and-drop visuals
• Fixed-price transparency—no hourly creep, no scope surprises
• Remote-first—seamless collaboration across time zones with clear communication
• Measurable outcomes—we define success metrics upfront: faster decisions, reduced reporting time, improved forecast accuracy
Remote worldwide • Available globally (timezone-flexible) • Fixed-price proposals
🔥 Hire Me for Your Power BI Dashboard Project
If this AECOM financial dashboard case study demonstrates the level of insight and technical execution you need for your business, I'm available to build similar solutions for your organisation.
What you get when you hire me as a freelance Power BI developer:
• Production-ready Power BI dashboards built on your real financial or operational data
• Custom DAX measures for metrics that matter to your business (not just standard KPIs)
• Clear documentation and training so your team can maintain and extend the solution
• Measurable outcomes defined upfront: ROI targets, efficiency gains, or decision speed improvements
• Transparent pricing: fixed-price projects or hourly consulting — scoped in the free discovery call
Industries I Serve as a Power BI Consultant
I've built financial and operational Power BI dashboards for clients who hired me across:
- Infrastructure & Professional Services: Revenue analysis, project profitability, capital allocation ROI
- E-Commerce & Retail: Sales performance, customer lifetime value, inventory forecasting
- SaaS & Subscription Businesses: Cohort retention, trial conversion, revenue dashboards
- Financial Services: Solvency analysis, risk modeling, regulatory reporting automation
Ready to Hire a Power BI Developer? Next Steps:
- Book your free 30-minute discovery call via my contact page
- Share your business goals and data sources (I'll sign an NDA if needed)
- Receive a fixed-price proposal with timeline and deliverables within 48 hours
- Approve and begin development with weekly demos and transparent communication
No obligation • Fixed-price proposals • Remote worldwide • 2-6 week typical delivery